A surf forecast is something we surfers use to make an educated guess on how the waves are going to look like. A surf forecast is much like a weather forecast in the sense that it predicts the surf conditions for a future date. It’s not the same as a surf report; a surf report is a description of the current surfing conditions, not a prediction of the future. Before we dive into why you should use a surf forecast and how to use it, let’s give a basic explanation on how waves are generated in the first place.
A surfing wave is born in a low pressure area. A low-pressure area (cyclone) is a region where the atmospheric pressure is lower than its surroundings. Wind circle anti-clockwise around lows in the northern hemisphere, and clockwise in the southern hemisphere. This wind is important as this generates waves at the open ocean.
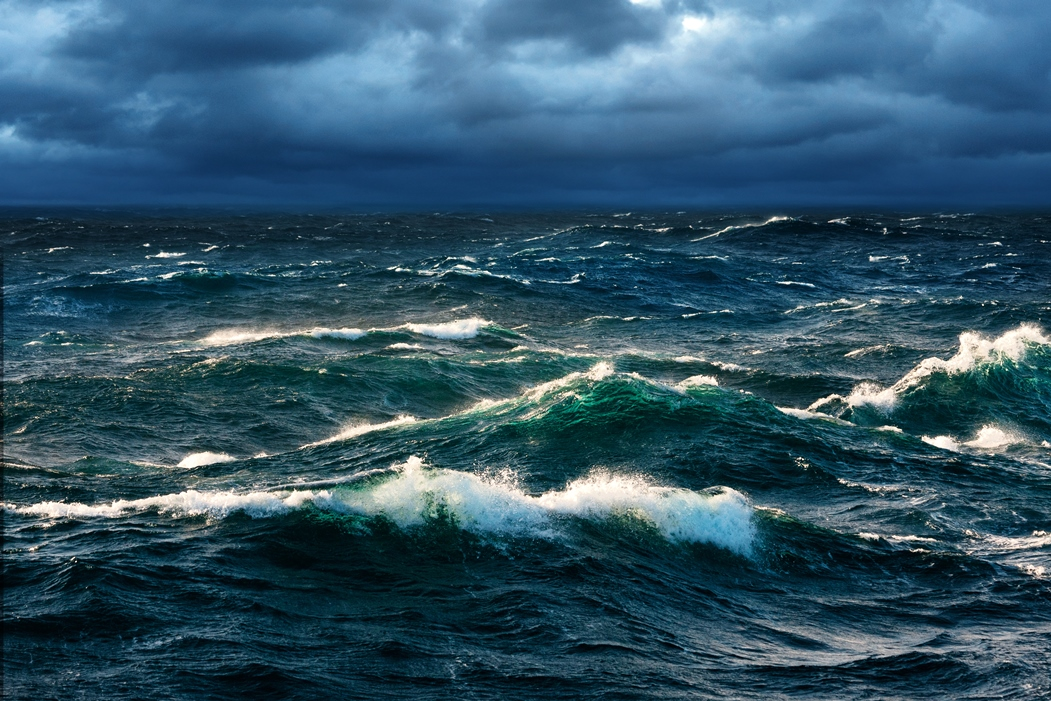
The wind that generates the waves can be explained as “energy” that travels. Water is not moving, it transports energy. As this energy travels, waves are “organised” into **swell**. This energy can travel thousands of kilometres without losing strength.
When swell arrives at shallow water it slows down and eventually breaks: the surfing wave we love so much. The quality of this surfing wave depends on a lot of factors, but the most important ones are the **bottom type** (bathymetry), **tides** and **wind**, which we will discuss in this article.
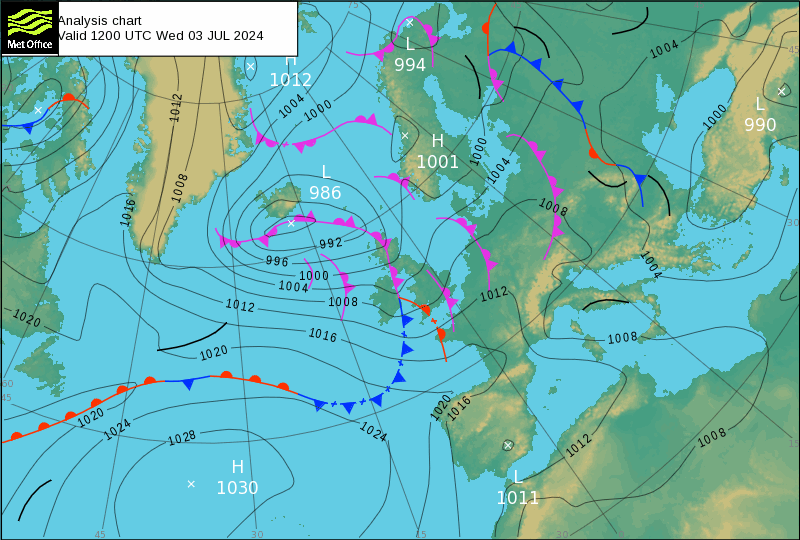
Before surf forecasts, surfers used surface pressure charts to guess how the surf was going to look like in the next days. A surface pressure chart is a special type of weather map that plots and traces sea level air pressure. It can be used to see if waves are generated on the open ocean by a low pressure (these waves turn into neatly organised swell while they travel the open ocean). Surface pressure charts are still a very important tool in your surfer’s tool belt, but surf forecasts can make one’s life way easier. Surface pressure charts are outside the scope of this article.
A surf forecast as you well know from surf forecasting websites such as Surfline, Windguru, Windy, or this one (Surfnerd) use data that is created by organisations that create weather forecasts such as ECMWF or NOAA. This data is made available by running complex simulations of how the weather will behave in the next couple of days. These simulations are being constantly corrected and refined using real-time data, such as data from buoys and satellites (data assimilation).
What is this data we are talking about? It’s mostly numbers, like wind speed, wind direction, swell height, swell period. We will discuss every data point relevant to surf forecasting in detail in this article. We’ll break it down into three categories:
The most important factor to consider when looking at a surf forecast is metrics about swell. Without swell (or wind waves) there will be no surfing waves. In other words: no swell or wind waves, don’t bother looking further.
Waves on oceans and seas all have unique heights, lengths and directions (we call this the two-dimensional wave spectrum). The wave spectrum can be broken down into wind-sea waves (created by local winds), and a number of individual swell partitions (created by wind far away). Because there can be multiple low-pressure systems in an area, we can divide the swell up into multiple partitions. In most forecasts, when we speak of swell, we mean the dominant swell partition. Some surf forecasts also mention the secondary (or sometimes tertiary) swell partitions.
There are a bunch of factors to consider when looking at swell metrics, namely the swell height, swell period, swell direction, wind-sea wave height and wind-sea wave direction.
The swell height metric (or [significant wave height](https://en.wikipedia.org/wiki/Significant_wave_height) of the ll partition) is a calculation of the average wave height of the highest third of the primary swell partition. It’s a “mathematical” expression of the height estimation of a “trained observer”. What this means is that this metric is similar to how a trained observer would estimate the wave height to be (measured from trough to crest). The metric only tracks swell (waves that are generated far out and have had the time to neatly line up). Locally generated waves are not included in this metric.
The swell period is the average time it takes for two consecutive waves to pass through a fixed point (from crest to crest). Swell period is an important metric because it can tell a lot about the size of a surfing wave and the way it breaks. The higher the period, the bigger, more powerful and steeper the waves get. A doubling in period can actually cause a 5x increase in surfing wave height
Another swell factor to consider is the mean direction of the swell. When a swell hits directly, the surfing wave height will be bigger than when a swell hits it from the side or needs to wrap around a headland. That said, if the swell is long-period and powerful, it can still wrap into spots and produce great waves.
Other swell partitions can influence the surfing experience. A secondary swell with a higher period can sometimes generate better waves than the dominant swell. Or, it can combine with the dominant swell to create more complex or messy wave patterns. Checking secondary swells can help you spot sneaky good sessions.
Some coasts need them, others hate them. Wind-sea waves are locally generated and tend to be shorter-period and more chaotic. In swell-rich zones, wind-sea waves often ruin the lineup. But in places like the North Sea or the French coast, they’re the main driver for surf. Local knowledge is key.
When we talk about wind, we mean the surface wind at the surf spot—not the wind out at sea that generates swell. Local wind can make or break your session. There are two key elements to consider: wind direction and wind speed. Some wind directions work in your favour, while others don't. Here's how they're typically classified:
A good rule of thumb is that the more favorable the wind direction, the stronger the wind can be while still creating quality waves. For example, light offshore winds are great, but a moderate or even strong offshore wind can hold waves up longer and make them hollower—especially on beach breaks.
Some spots can still deliver high quality waves in unfavourable wind directions, oftentimes caused by obstacles or land features blocking the wind.
The wind speed in a surf forecast typically refers to the average sustained wind speed over a set time interval—usually 10 minutes—excluding short gusts or lulls.
Gusts can affect wave quality in subtle but important ways. Even if the average wind direction is favorable, gusty conditions can create sudden chops on the wave face, blow spray into your eyes, and make it harder to paddle in—especially with strong offshore gusts. While steady wind is manageable (and sometimes even helpful), gusts introduce variability that can make a session feel inconsistent or harder to read. Sometimes the wind can be very “gusty”, and this definitely has it’s effects on the quality of the waves.
Tides are the regular rise and fall of sea levels caused by the gravitational pull of the moon and sun. They change every day and influence when, where, and how waves break.
Some places have a huge tidal range—meaning a big difference between high and low tide—which can completely change the surf. Other places have only a small tidal shift, where changes are more subtle. Knowing your local spot's tidal behavior is key. For example, the southwest coast of France has a large tidal range that can completely transform the surf across a session. In contrast, the Mediterranean often has a very small tidal range, where the impact on surf is minimal.
Tide impact varies dramatically from spot to spot. Some breaks work well at any tide and perform on both incoming and outgoing tides. Others are highly tide-dependent—only firing at dead low, or just as the tide starts to push in. It all comes down to local bathymetry and how the swell interacts with the seafloor.
A surf forecasts is a powerful tool to plan your sessions. I built Surfnerd to help local surfers make better calls—whether it’s time to grab your board and go, or stay home and hang with your kids. A prediction will be off some of the times, but it’s pretty useful.
A surf forecast becomes more useful if it doesn’t just display the data in a nice manner, but also enrich it. There are a couple of ways we try to do that:
That’s it. You now know how to read a surf forecast. Hopefully this guide helps you score more good sessions—and skip the disappointing ones. Surf forecasts aren’t perfect, but they’re a powerful tool when you understand what to look for. Combine the data with your local knowledge, keep an eye on the charts, and trust your gut. Have fun!