A surf forecast is something we surfers use to make an educated guess on how the waves are going to look like. A surf forecast is much like a weather forecast in the sense that it predicts the surf conditions for a future date. It’s not the same as a surf report; a surf report is a description of the current surfing conditions, not a prediction of the future. Before we dive into why you should use a surf forecast and how to use it, let’s give a basic explanation on how waves are generated in the first place.
A surfing wave is born in a low pressure area. A low-pressure area (cyclone) is a region where the atmospheric pressure is lower than its surroundings. Wind circle anti-clockwise around lows in the northern hemisphere, and clockwise in the southern hemisphere. This wind is important as this generates waves at the open ocean.
The wind that generates the waves can be explained as “energy” that travels. Water is not moving, it transports energy. As this energy travels, waves are “organised” into **swell**. This energy can travel thousands of kilometres without losing strength.
When swell arrives at shallow water it slows down and eventually breaks: the surfing wave we love so much. The quality of this surfing wave depends on a lot of factors, but the most important ones are the **bottom type** (bathymetry), **tides** and **wind**, which we will discuss in this article.
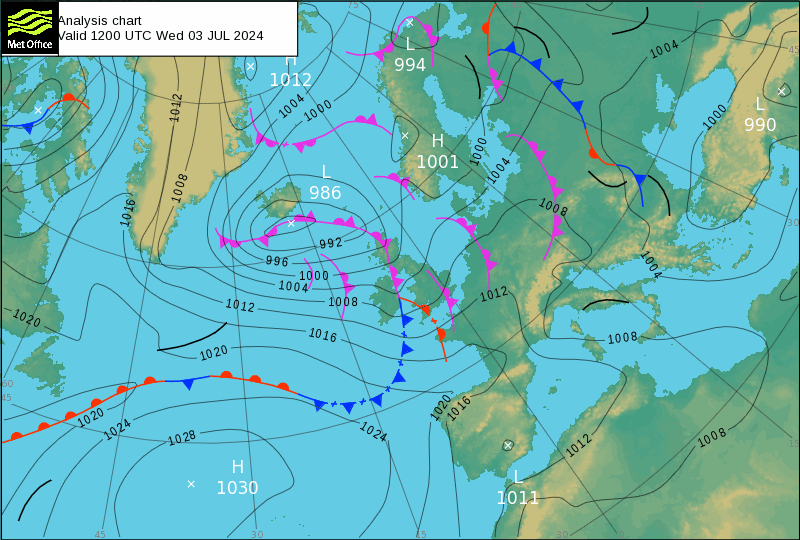
Before surf forecasts, surfers used surface pressure charts to guess how the surf was going to look like in the next days. A surface pressure chart is a special type of weather map that plots and traces sea level air pressure. It can be used to see if waves are generated on the open ocean by a low pressure (these waves turn into neatly organised swell while they travel the open ocean). Surface pressure charts are still a very important tool in your surfer’s tool belt, but surf forecasts can make one’s life way easier. Surface pressure charts are outside the scope of this article.
A surf forecast as you well know from surf forecasting websites such as Surfline, Windguru, Windy, or this one (Surfnerd) use data that is created by organisations that create weather forecasts such as ECMWF or NOAA. This data is made available by running complex simulations of how the weather will behave in the next couple of days. These simulations are being constantly corrected and refined using real-time data, such as data from buoys and satellites (data assimilation).
What is this data we are talking about? It’s mostly numbers, like wind speed, wind direction, swell height, swell period. We will discuss every data point relevant to surf forecasting in detail in this article. We’ll break it down into three categories:
The most important factor to consider when looking at a surf forecast is metrics about swell. Without swell (or wind waves) there will be no surfing waves. In other words: no swell or wind waves, don’t bother looking further.
Waves on oceans and seas all have unique heights, lengths and directions (we call this the two-dimensional wave spectrum). The wave spectrum can be broken down into wind-sea waves (created by local winds), and a number of individual swell partitions (created by wind far away). Because there can be multiple low-pressure systems in an area, we can divide the swell up into multiple partitions. In most forecasts, when we speak of swell, we mean the dominant swell partition. Some surf forecasts also mention the secondary (or sometimes tertiary) swell partitions.
There are a bunch of factors to consider when looking at swell metrics, namely the swell height, swell period, swell direction, wind-sea wave height and wind-sea wave direction.
The swell height metric (or significant wave heightof the swell partition) is a calculation of the average wave height of the highest third of the primary swell partition. It’s a “mathematical” expression of the height estimation of a “trained observer”. What this means is that this metric is similar to how a trained observer would estimate the wave height to be (measured from trough to crest). The metric only tracks swell (waves that are generated far out and have had the time to neatly line up). Locally generated waves are not included in this metric.
The swell period is the average time it takes for two consecutive waves to pass through a fixed point (from crest to crest). Swell period is an important metric because it can tell a lot about the size of a surfing wave and the way it breaks. The higher the period, the bigger, more powerful and steeper the waves get. A doubling in period can actually cause a 5x increase in surfing wave height
Another swell factor to consider is the mean direction of the swell. When a swell hits directly, the surfing wave height will be bigger than when a swell hits it from the side or needs to wrap around a headland. That said, if the swell is long-period and powerful, it can still wrap into spots and produce great waves.
Other swell partitions can influence the surfing experience. A secondary swell with a higher period can sometimes generate better waves than the dominant swell. Or, it can combine with the dominant swell to create more complex or messy wave patterns. Checking secondary swells can help you spot sneaky good sessions.
Some coasts need them, others hate them. Wind-sea waves are locally generated and tend to be shorter-period and more chaotic. In swell-rich zones, wind-sea waves often ruin the lineup. But in places like the North Sea or the French coast, they’re the main driver for surf. Local knowledge is key.
Wave height alone rarely tells the full story. A forecast showing “1.2 m” can produce anything from soft, powerless waves to fast, heavy surf. That’s because wave height says little about how much energy is actually moving through the ocean.
Some surf forecasts exposes a metric called "wave energy". Wave energy expresses the real power of a swell by combining swell height and swell period into a single metric.
Two swells with the same height can feel completely different. A short-period swell may look fine on paper but fade quickly, while a longer-period swell of the same height can hit the coast with far more force, creating bigger and faster waves.
The difference is period. Longer periods carry more energy per wave. Looking at height without period often leads to:
Every surf forecast calculates wave energy differently. For this reason, you cannot compare wave energy of Surfline or Windguru with Surfnerd. What they do have in common is that the formula always weighs swell period more heavily than swell height. In practice this means:
This means a modest swell with a long period can carry more energy than a taller, short-period swell, and that energy increases faster than height alone suggests.
Wave energy is especially useful in these situations:
How to use wave energy in practice ? A simple rule of thumb:
Wave energy should be one of your first checks when scanning a forecast. Without enough energy, good wind or tide will rarely save a session.
Wave energy does not replace swell height or period. It puts them into context so you can make faster and more reliable decisions.
Every spot responds differently to energy. The minimum energy needed for waves to break, and the maximum a spot can handle, is highly spot-dependent.
When we talk about wind, we mean the surface wind at the surf spot—not the wind out at sea that generates swell. Local wind can make or break your session. There are two key elements to consider: wind direction and wind speed. Some wind directions work in your favour, while others don't. Here's how they're typically classified:
A good rule of thumb is that the more favorable the wind direction, the stronger the wind can be while still creating quality waves. For example, light offshore winds are great, but a moderate or even strong offshore wind can hold waves up longer and make them hollower—especially on beach breaks.
Some spots can still deliver high quality waves in unfavourable wind directions, oftentimes caused by obstacles or land features blocking the wind.
The wind speed in a surf forecast typically refers to the average sustained wind speed over a set time interval—usually 10 minutes—excluding short gusts or lulls.
Gusts can affect wave quality in subtle but important ways. Even if the average wind direction is favorable, gusty conditions can create sudden chops on the wave face, blow spray into your eyes, and make it harder to paddle in—especially with strong offshore gusts. While steady wind is manageable (and sometimes even helpful), gusts introduce variability that can make a session feel inconsistent or harder to read. Sometimes the wind can be very “gusty”, and this definitely has it’s effects on the quality of the waves.
Tides are the regular rise and fall of sea levels caused by the gravitational pull of the moon and sun. They change every day and influence when, where, and how waves break.
Some places have a huge tidal range—meaning a big difference between high and low tide—which can completely change the surf. Other places have only a small tidal shift, where changes are more subtle. Knowing your local spot's tidal behavior is key. For example, the southwest coast of France has a large tidal range that can completely transform the surf across a session. In contrast, the Mediterranean often has a very small tidal range, where the impact on surf is minimal.
Tide impact varies dramatically from spot to spot. Some breaks work well at any tide and perform on both incoming and outgoing tides. Others are highly tide-dependent—only firing at dead low, or just as the tide starts to push in. It all comes down to local bathymetry and how the swell interacts with the seafloor.
A surf forecasts is a powerful tool to plan your sessions. I built Surfnerd to help local surfers make better calls—whether it’s time to grab your board and go, or stay home and hang with your kids. A prediction will be off some of the times, but it’s pretty useful.
You now know how to read a surf forecast in general. This section explains how Surfnerd combines those fundamentals into a single view that helps you decide faster.
The goal is not to replace judgment, but to surface the right signals at the right moment.
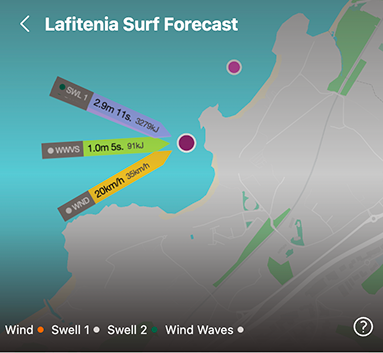
At the top of the page, the forecast map shows the selected spot with arrows for every relevant wave partition and the local wind for the selected hour. Each arrow represents direction and relative strength, making it easy to see how multiple swells interact and how wind affects the lineup.
This view is designed for quick pattern recognition. You can spot secondary swells, wind waves, and marginal wind angles at a glance. When arrows overlap, you can tap a metric label to bring that arrow to the front.
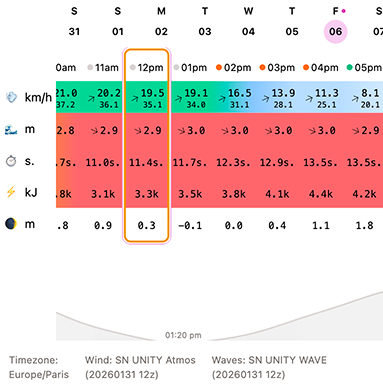
The hourly forecast table compresses wind, waves, tides, and predictions into a single timeline. It may look dense at first, but it is optimized for scanning and comparison rather than reading row by row.
The goal of this table is not to analyze every number, but to identify the best windows in time. Good sessions usually stand out through contrast. One or two hours will look clearly better than the rest.
The top row shows the forecast hour and the overall surf quality prediction. This prediction is derived from wave, wind, and tide conditions combined. It is meant as a quick signal, not a verdict.
Use this row to narrow your focus. When predictions improve or peak for a short window, it is often worth checking what changes underneath. When predictions stay poor for long stretches, it usually means one core factor is missing.
The wind row shows average wind speed, direction, and gusts. Color intensity increases with wind strength, moving from calm to strong. Direction arrows help you judge offshore, sideshore, or onshore flow relative to the spot.
Look for stability as much as direction. Light offshore or light sideshore wind that stays consistent over multiple hours is usually better than a perfect direction that comes with strong gusts or rapid changes.
When comparing hours, small wind shifts often matter more than small swell changes. A slight drop in wind speed or a subtle shift toward offshore can turn an average hour into a good one.
The wave section shows height and direction, period, and wave energy. Surfnerd selects a dominant wave using spot-adjusted surf energy (depth + directional fit). This is usually the primary swell, but during local storms it can be wind waves. In that case, values are shown in gray and italic.
When the dominant wave switches from swell to wind waves, conditions often become less predictable. This is a useful signal when deciding whether a session is worth the effort. Because dominant selection is spot-adjusted, nearby spots can occasionally show different dominant partitions.
Wave energy in the table helps you judge whether a swell has enough power for the spot. For Surfnerd+ and trial users, Surfnerd displays surf energy by default and includes a toggle to view physical energy based on the deep water wave power formula. Surf energy additionally adjusts for local depth and swell direction to estimate how much usable energy reaches the break.
When scanning the table, prioritize wave energy over raw height. If energy drops below a certain threshold for your spot, even clean wind and good tides rarely produce quality waves.
The tide section shows hourly water levels and highlights tidal flow and extremes. This helps you align wave energy and wind with the tide window that works best for the spot.
Instead of focusing only on high or low tide, look at how fast the tide is moving. Many spots work best during a specific part of the tide cycle, such as the push or the drop. The hourly view helps you time that window precisely.
Strong swell combined with the wrong tide often leads to closeouts or heavy conditions. Moderate swell paired with the right tide can be far more surfable.
Surfnerd uses its own ensemble model, Surfnerd Unity. This model blends data from multiple wave and wind models to reduce single-model bias and surface a more stable forecast.
For waves, Surfnerd combines ECMWF WAM and GFS Wave, with support for BOM AUSWAVE in progress. For wind, it uses ECMWF Atmos, GFS Atmos, and Harmonie for the Netherlands. Additional regional wind models are evaluated and added where they improve local accuracy.
Blending models helps smooth out outliers. Individual models can be wrong, especially in complex or fast-changing situations. Agreement across models usually signals a more reliable forecast.
You can inspect individual wave or wind models in the Model settings. This makes it possible to compare sources and understand where a forecast comes from.
Looking at individual models is especially useful in marginal or long-range forecasts. If models disagree on timing, direction, or strength, conditions are more uncertain and flexibility matters.
Model settings also allow you to enable confidence scores. High confidence means models broadly agree on the outcome. Low confidence means models diverge, and conditions are more uncertain.
Use confidence as a planning tool. High confidence days are good for committing time and travel. Low confidence days can still deliver, but they benefit from last-minute checks and backup options.
A surf forecast is not a promise. It is a structured way to reduce uncertainty. By understanding how waves are generated, how swell, wind, and tides interact, and how different metrics relate to real conditions in the water, you can make better calls and avoid relying on guesswork.
No single number tells the whole story. Good decisions come from combining signals, recognizing patterns, and applying local knowledge. Forecasts work best when they are read in context and adjusted to the spot you are surfing.
Use surf forecasts to narrow down your options, not to chase perfection. When you understand what you are looking at, even imperfect forecasts become powerful tools for scoring better sessions and skipping the bad ones.